BI @ RU
What’s New
- We’re launching a Toolkit for Tableau Dashboards. Explore new ways to keep track of essential metrics and share results to your stakeholders.
- Salesforce integration for our systems have begun. We are busy migrating data, updating our data element mappings, and translating existing views to the new system.
WAYS TO UTILIZE YOUR DATA
Let’s Build Together.
Data management is foundational for integrating BI processes into your unit.
Your insights are as good as the data you have access to. Here at Enterprise Business Intelligence Analytics we want our community to utilize their data effectively and without comprising its security. To make impactful decision based on data insights, our team is made of technical support staff with experience in database administration (DBA) and ERP Apps-DBA environments.
We support a broad range of services to meet the requirements of the University’s enterprise systems.
To learn more about how to request data services, visit the ‘Request’ tab on the menu.
Dashboard Toolkit

Use Case: Showing comparisons of what school students enrolled vs. where they graduated.
![]()
Use Case: Infographics that turns into interactive analytics
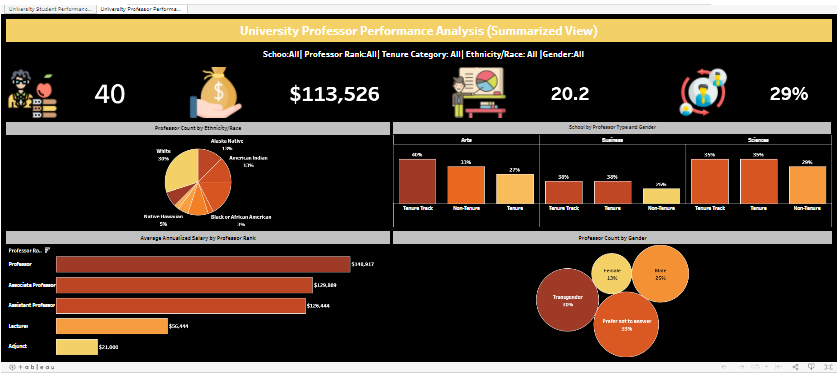
Use Case: High level overview of your school’s performance
For more ideas please check out Reporting & Dashboards.
Take your deliverables to the next level.
Sign up for a BI team consultation: Contact Us