Paleoclimatology, Data Reading, & Scientific Thinking
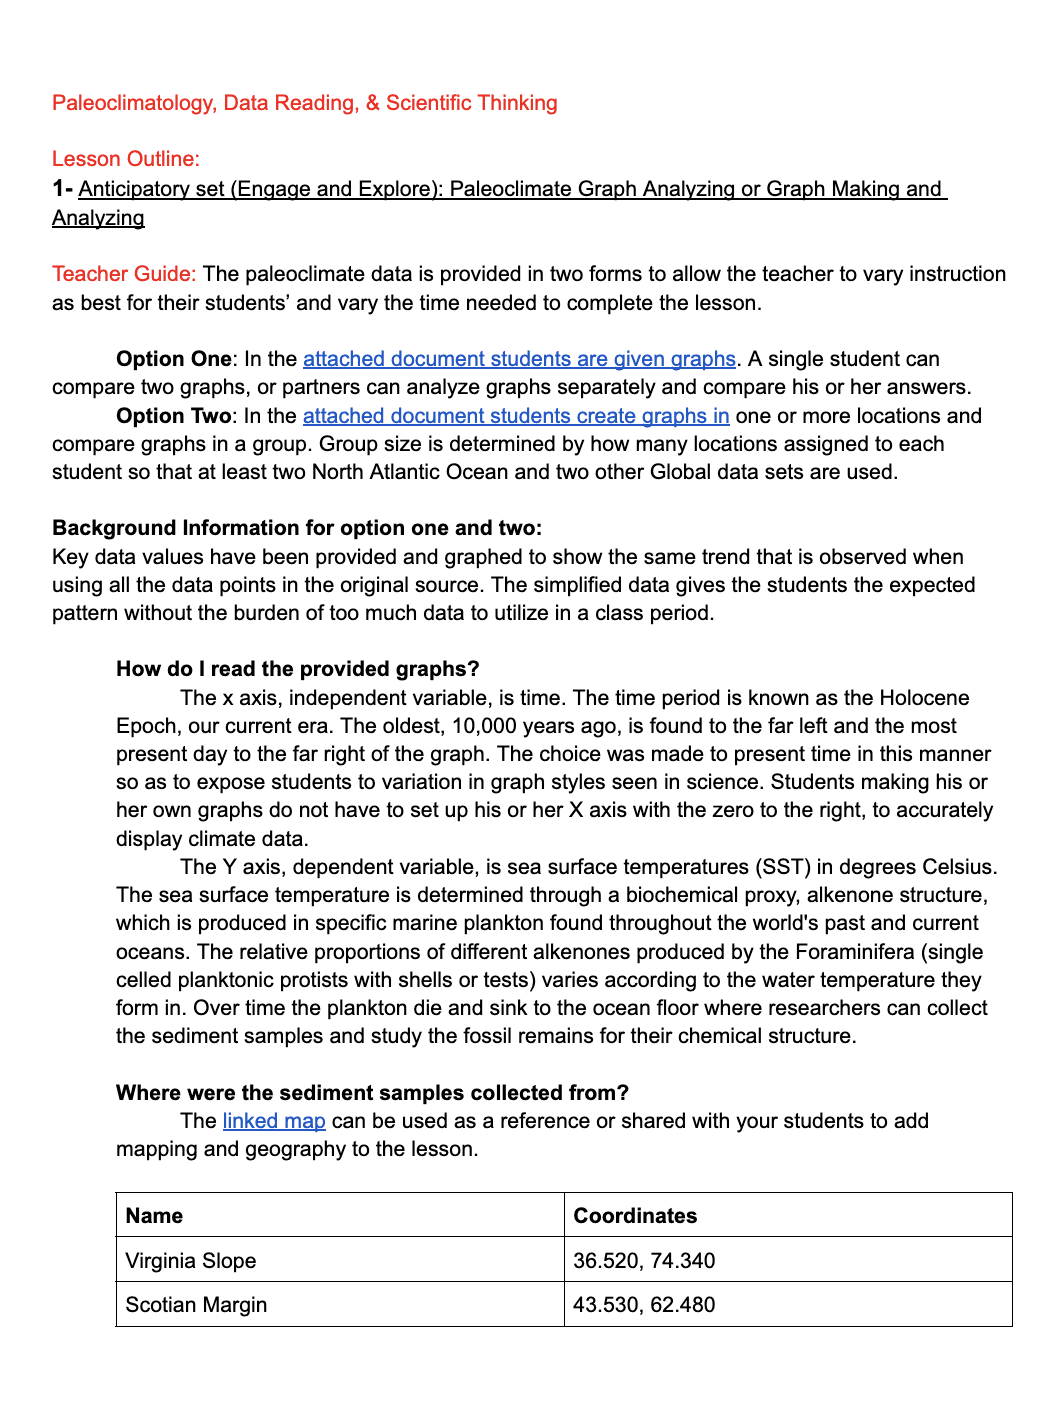
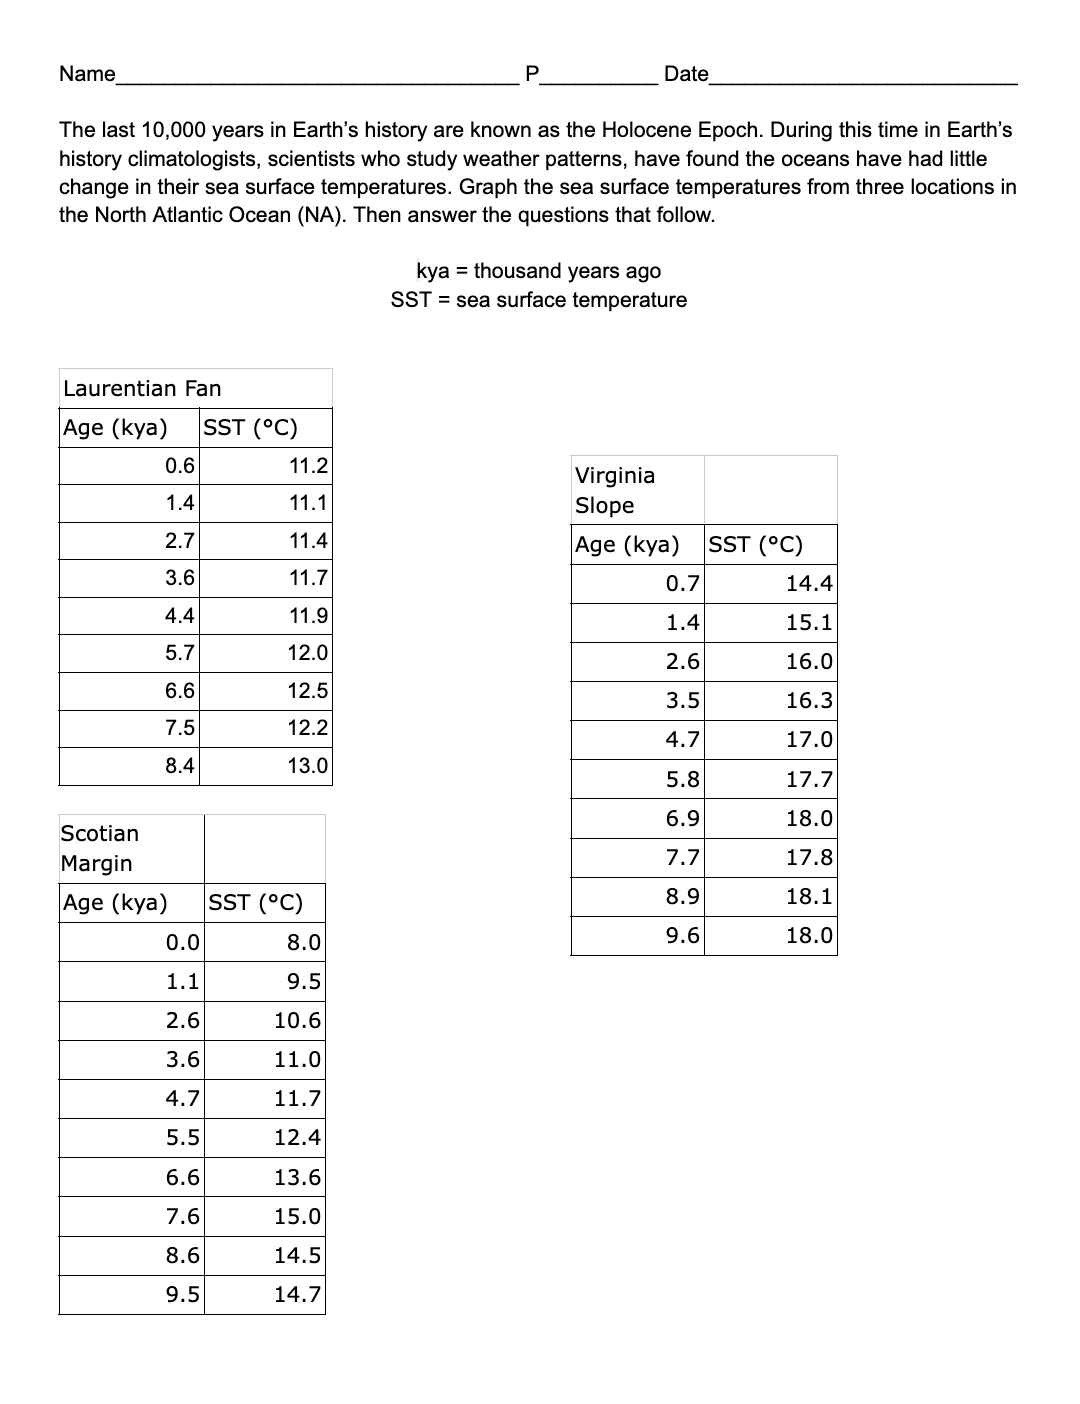
The Paleoclimatology, Data Reading, & Scientific Thinking learning plan created by Ms. Erin Sharpe is built to introduce students to the methods and motives behind graphing paleoclimate data. Using the attached documents, teachers will explain the process of creating and reading paleoclimate graphs. This opens up the conversation for the importance of gathering paleoclimate data, as well as provides an opportunity to further investigate ocean sampling and related topics.
VIEW THE PALEOCLIMATE DATA COLLECTION POINTS HERE!
This lesson plan satisfies the following learning standards:
MS ESS3-5 Earth and Human Activity Ask questions to clarify evidence of the factors that have caused the rise in global temperatures over the past century.
HS ESS3-5 Earth and Human Activity Analyze geoscience data and the results from global climate models to make an evidence-based forecast of the current rate of global or regional climate change and associated future impacts to Earth systems.
HS ETS1-3 Evaluate a solution to a complex real-world problem based on prioritized criteria and trade-offs that account for a range of constraints, including cost, safety, reliability, and aesthetics as well as possible social, cultural, and environmental impacts.


READING
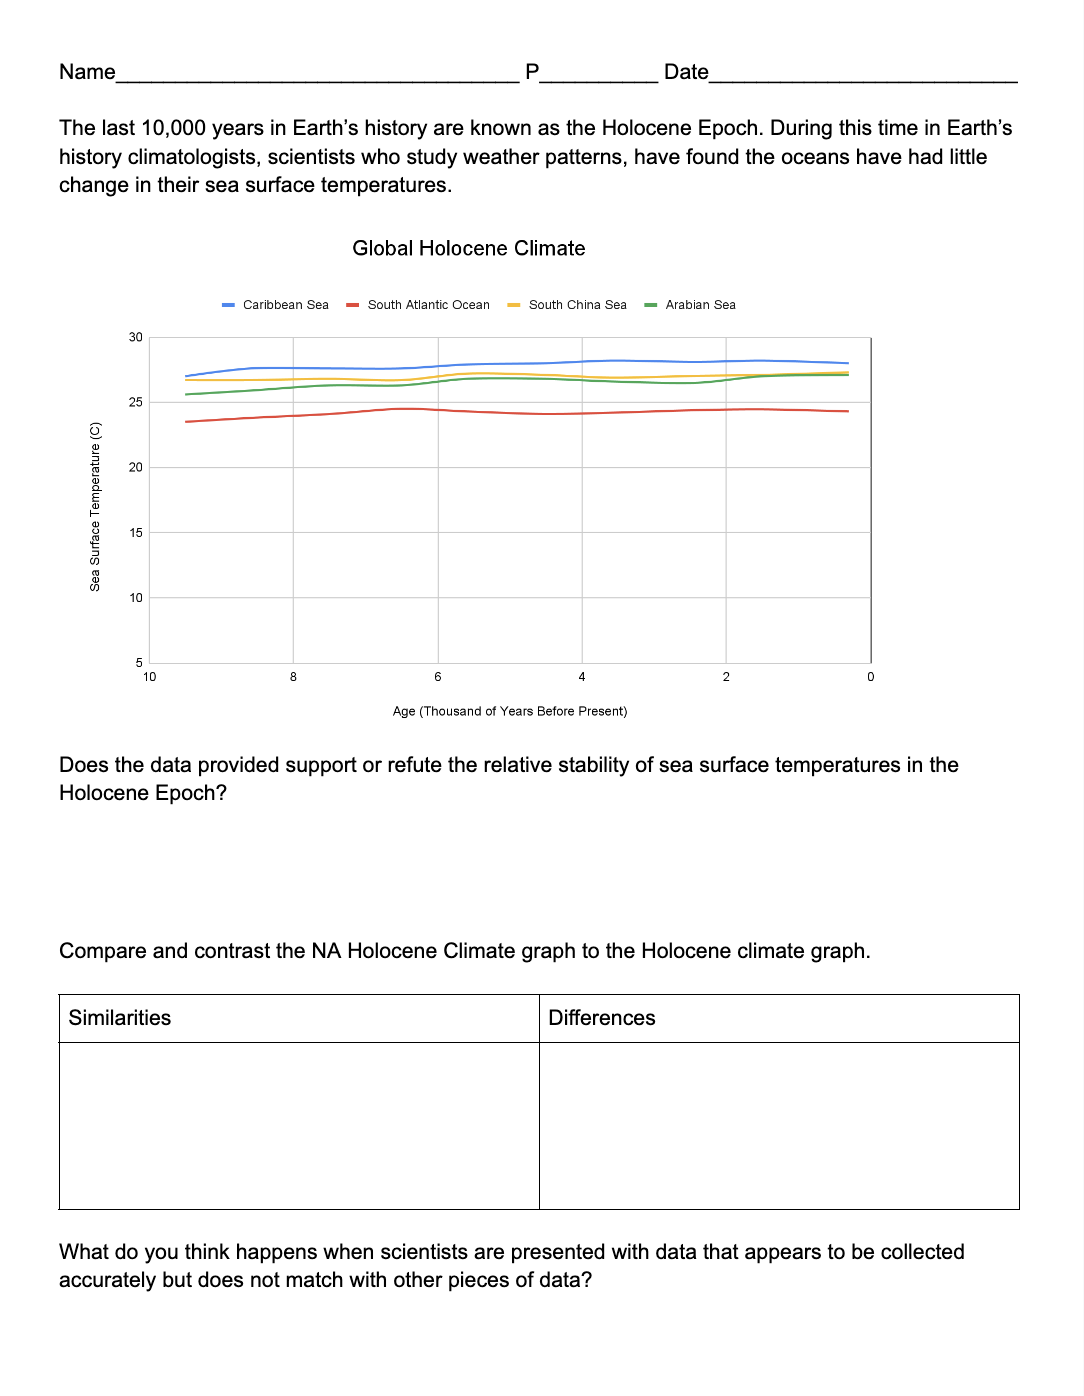
PALEOCLIMATE GRAPHS
Provide students with the Reading Paleoclimate Graphs worksheet to teach them how to interpret paleoclimate data.
