A Hidden Landscape
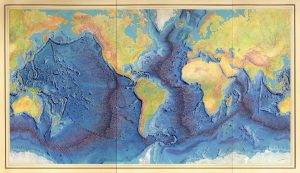
Looking out at the vast emptiness of the open sea, it would be easy to assume the ocean floor would be likewise featureless. This couldn’t be further from the truth, as there are literal mountain ranges on the bottom of the world’s oceans. Just take a look at the famous ocean bathymetric map created by Heezen and Tharpe and first published in 1977. Their groundbreaking work based on bathymetric and seismographic changed the way scientists saw the world and thought about the ocean floor. Stick your finger on any part of this map and you will see a myriad of ocean bottom features including continental shelves, deep-sea trenches, mid-ocean ridges, seamounts, and the deep abyssal plains.
All of this means that you can’t just send coring material down anywhere into the ocean to collect mud. You need to have an idea of what bathymetric features lay beneath the ship and the potential for pockets of mud. Scientists have a general idea of the features in an area based on broad bathymetric maps
such as the one created by Heezen and Tharpe, and data collected from previous oceanographic research studies (i.e. multi-beam sonar data). General target areas can be selected this way, but exact coring locations have to be decided on in the field.
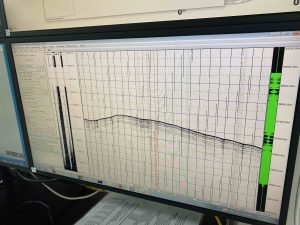
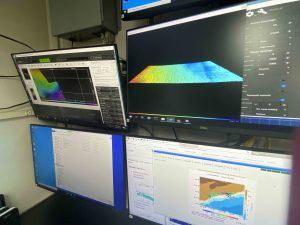
Once the boat has steamed to the research area, you begin to survey the ocean floor for your coring locations. This is done utilizing multi-beam sonar and 3.5 kilohertz seismic. Both of these methods use a source that sends a sound wave towards the bottom of the ocean, and measures the depth and shape of the floor by calculating the time it took to return to the source. This is the same method bats use to locate their prey while flying. The 3.5 kilohertz data provides a profile of how the sediments are arranged on the sea floor (seen in black and white on the computer screen). Whereas the multi-beam sonar creates a 3-D image of the ocean bathymetry (see the rainbow colored image on the computer screen).
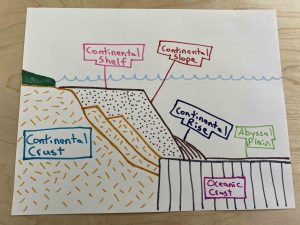
The main objective of this cruise is to obtain a transect of cores and water samples from shallow and deep water depth locations. This will allow the scientists and oceanographers to better reconstruct changes across the entire water column and at various depth locations in the past. The sampling locations are picked based on the 4 major classifications of ocean floor features; the continental shelf, the continental slope, the continental rise, and the abyssal plain.
I drew the above diagram to help illustrate the primary characteristics of these bathymetric areas. Note, this diagram is not to scale and it is vertically exaggerated. Meaning that the slopes between the features is draw much steeper than it is in reality. This is done to better see the difference between the distinctive areas. If I drew this more to scale, it would be a really boring almost flat line, but more on these angles later.
Start on the left side of the diagram with the green blob, this is the continent where we live similar to the east coast of North America. Continental crust lays underneath the continent, the continental shelf, and part of the continental slope. This is hard rock made up mostly of granite with an average thickness of 40 km (i.e. ~25 miles). The rest of the sections are underlain by oceanic crust, composed of the more dense basaltic rocks (average thickness of ~10 km or 6.2 miles).
The continental shelf extends from just beyond the shore to about 200 m water depth. The shelf also makes up the margin of the continent. Along continental edges where there is an active plate tectonic boundary (for example off the coast of Japan or the Aleutian Islands in Alaska), the margin is very narrow. Whereas on the edges of passive margins, or where there is no active plate boundary, the shelf and margin are very wide. This is the case for the continental shelf/margin where we are coring. The maximum water depth of the shelf is ~200 m (0.12 miles), but can also be much shallower. The shelf is very flat, with a maximum angle of only 0.3 degrees. This is also the part of the ocean where all the sediments accumulate that have been eroded off land and transported to the ocean by rivers.
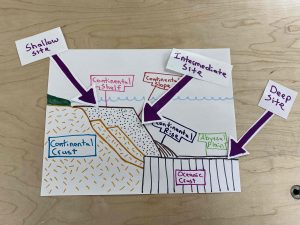
Scientists on the ship are targeting the shelf offshore Nova Scotia and Southern New Jersey for our shallow core location (see second diagram). They attempted to collect a gravity core (see other post for description) along the shelf offshore Canada, but it was “bounced” twice. This means that the sediment was too hard for the coring equipment to penetrate the mud and it returned to the ship empty. This coring location had to be abandoned due to time constraints. We only have some much time as sea and if things don’t work at a specific location, we have to move on. As I write this, we are currently floating over the continental shelf collecting water samples. Another attempt at a shallow shelf core will be made when we get to our New Jersey location.
At the edge of the continental shelf you reach the shelf break that leads to the continental slope. This is the steepest part of the ocean with a slope of only 2 degrees. Even though this is considered steep for the ocean, if you were to walk along the shelf, you wouldn’t even notice a change in the elevation. The slope is draped with sediments and can extend all the way down to 4 km in depth (~2.5 miles). It is often cut by deep canyons that transport large amounts of sediment from the shelf down to the deepest part of the oceans. These are called turbidites and they are similar to landslides that occur above the surface of the ocean. The continental shelf is the target for our intermediate cores (see second diagram), and the PUFINS team was able to collect some beautiful mud from one of these intermediate depth sites (see the picture of the core below).
The continental rise is the transition area between the slope and the deep abyssal plain. It is composed of layers of deposited sediment that have been transported down slope by the turbidites. The rise can extend from about 4 to 4.5 km (2.5 to 2.7 miles) in depth. We are not attempting to core on this area because most of the sediments have been disturbed and the records obtained from cores in this area would not be an accurate reflection of the climate history.
The final bathymetric area of the ocean floor is the abyssal plain. This is the flattest surface found anywhere on Earth and can extend anywhere from ~4 to 5 km (2.5 to 3.1 miles) below the sea surface. This landform also covers the largest area of the ocean and is dotted with more undersea features such as seamounts. Cores from over 3,500 meters deep (~2.2 miles) were collected from the abyssal plain offshore Nova Scotia over the last few days. This area of the ocean is so deep that it takes over 1.5 hours for the coring material to make its way from the deck of the ship to the bottom of the sea floor, and then another 1.5 hours to travel back up.
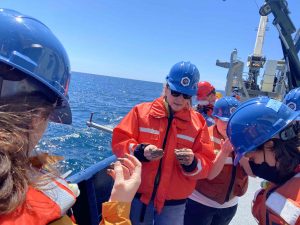
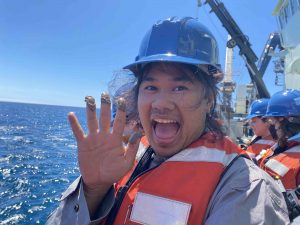
Despite some of the early failures, the whole scientific team was bursting with excitement when the first mud came onboard. We all took some time to celebrate this milestone before getting to work on logging, sampling, and archiving the cores for years worth of scientific study. Now the real work begins!